VectorLabels
The VectorLabels tag is used to create labeled vectors.
Use with the following data types: image.
Path and point basics
| Action | Instruction |
|---|---|
| Add points | Click on empty space. |
| Add points to path segments | Press Shift while clicking on a segment that is between two points. |
| End or exit the path | Press Esc or double-click on the last point you added to the path. |
| Move points | Simply click a point and drag to reposition. |
| Delete points | Press Alt or Option and click on an existing point. |
note
Several options require you to complete the path and then re-select it as a region.
The easiest way to handle this is to enable Select region after creating it in your labeling settings (found below the labeling interface in the labeling stream and Quick View).
You can also first exit the path and then reselect it by clicking on a segment within the path or by clicking it under the Regions panel.
Selected paths are highlighted red. For this reason, you should avoid red when choosing label colors for your vector paths.
Advanced
Multi-select
With multi-select, you can drag multiple points to reposition or resize them.
| Action | Instruction |
|---|---|
| Select multiple points |
|
| Select multiple paths | Use the move tool (the arrow) to click and drag multiple paths/shapes. |
| Resize multiple paths | Use the move tool (the arrow) to select multiple paths and then click and drag points in the selection box |
| Clear selection | Click on any point or press Esc. |
Closed paths
You can create closed paths to create polygon shapes. To create closed paths, use the closable="true" parameter in your labeling configuration.
| Action | Instruction |
|---|---|
| Close the path | Double-click on your final point. This automatically adds a segment between your first point and final point. |
| Break closed path | Press Alt or Option and click on a vector segment in a closed path to reopen it. Click on a point to delete the point. |
Skeleton
You can create skeleton vectors using the skeleton="true" parameter in your labeling configuration.
When enabled, new points connect to the active point and not the last added point.
Usage examples
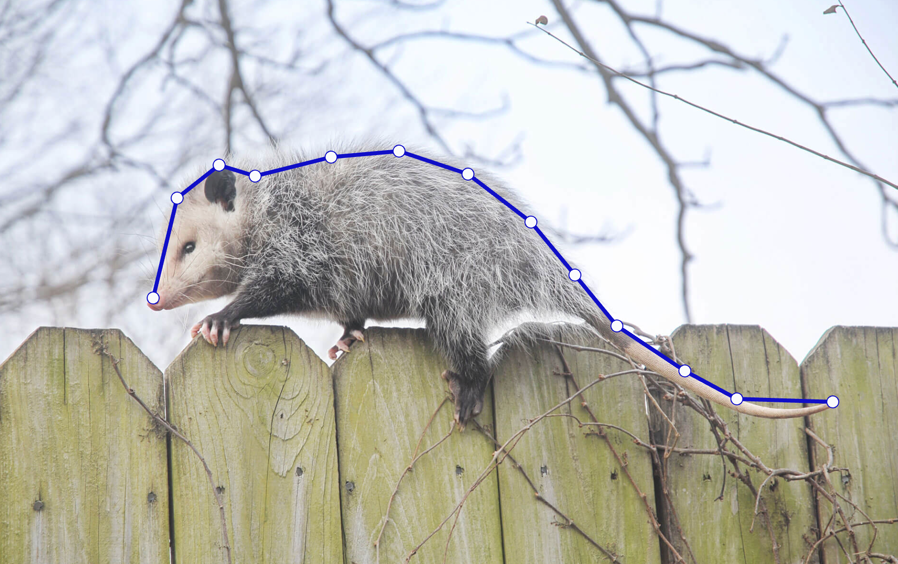
Basic vector path
<View>
<Image name="image" value="$image" />
<VectorLabels name="labels" toName="image">
<Label value="Road" />
<Label value="Boundary" />
</VectorLabels>
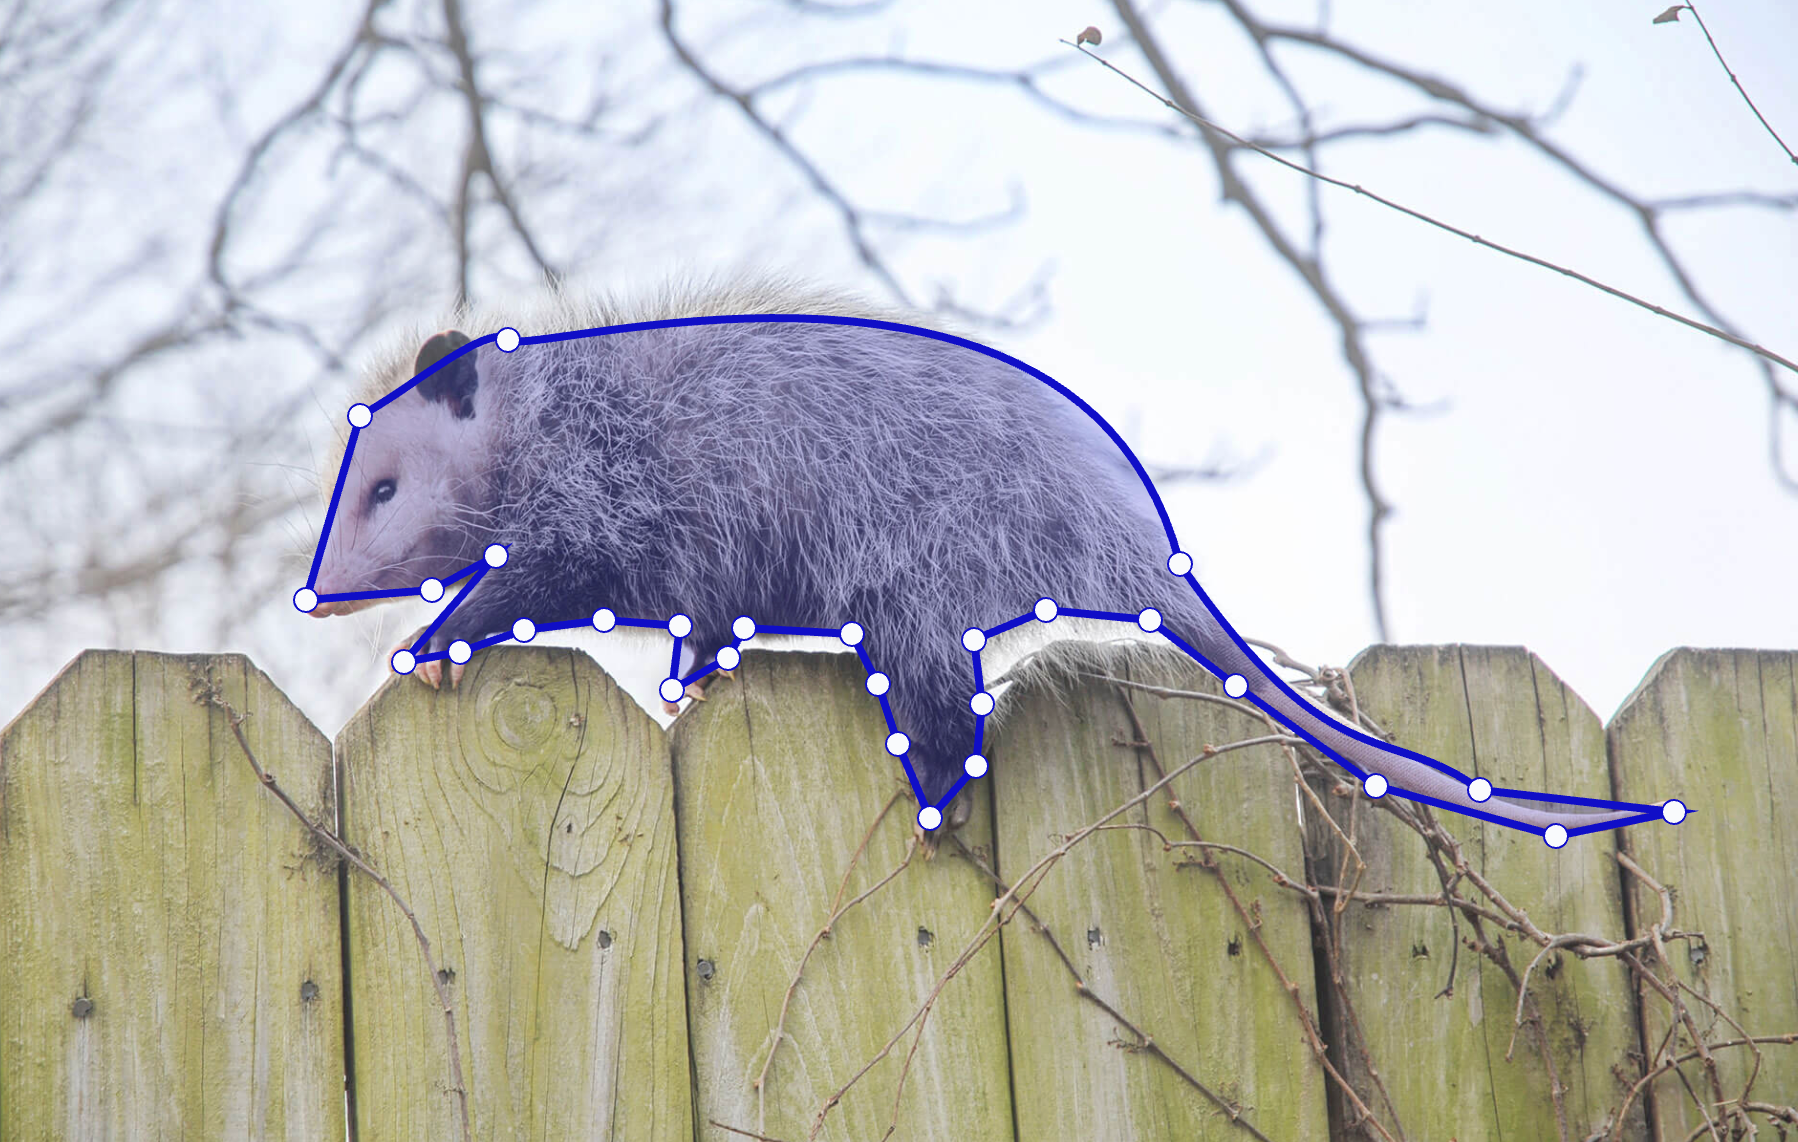
</View>Closed polygon
<View>
<Image name="image" value="$image" />
<VectorLabels
name="polygons"
toName="image"
closable="true"
minPoints="3"
maxPoints="20"
>
<Label value="Building" />
<Label value="Park" />
</VectorLabels>
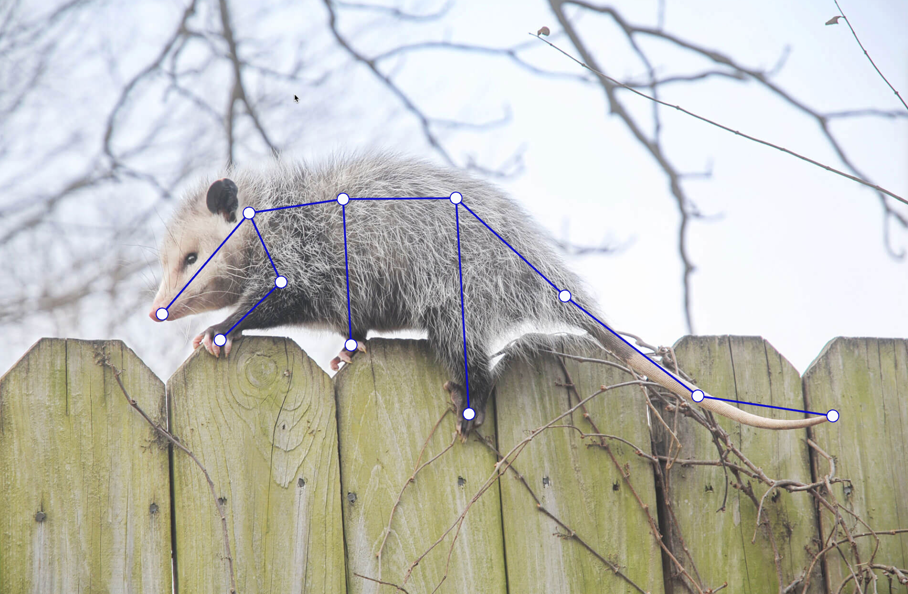
</View>Skeleton mode for branching paths
<View>
 <Image name="image" value="$image" />
 <VectorLabels
   name="skeleton"
   toName="image"
   skeleton="true"
   closable="false"
 >
   <Label value="Tree" />
   <Label value="Branch" />
 </VectorLabels>
</View>
Keypoint annotation tool
<View>
 <Image name="image" value="$image" />
 <VectorLabels
   name="keypoints"
   toName="image"
   closable="false"
   minPoints="1"
   maxPoints="1"
 >
   <Label value="Eye" />
   <Label value="Nose" />
   <Label value="Mouth" />
 </VectorLabels>
</View>
Point-constrained drawing
<View>
 <Image name="image" value="$image" />
 <VectorLabels
   name="constrained"
   toName="image"
   closable="true"
   snap="pixel"
   minPoints="4"
   maxPoints="12"
 >
   <Label value="Region" />
 </VectorLabels>
</View>
Tag parameters
Parameters
| Param | Type | Default | Description |
|---|---|---|---|
| name | string |
Name of tag | |
| toName | string |
Name of image to label | |
| [choice] | single | multiple |
single |
Configure whether you can select one or multiple labels |
| [maxUsages] | number |
Maximum number of times a label can be used per task | |
| [showInline] | boolean |
true |
Show labels in the same visual line |
| [opacity] | number |
0.2 |
Opacity of vector |
| [fillColor] | string |
Vector fill color in hexadecimal | |
| [strokeColor] | string |
Stroke color in hexadecimal | |
| [strokeWidth] | number |
1 |
Width of stroke |
| [pointSize] | small | medium | large |
medium |
Size of vector handle points |
| [pointStyle] | rectangle | circle |
rectangle |
Style of points |
| [snap] | pixel | none |
none |
Snap vector to image pixels |
| [closable] | boolean |
false |
Allow closed shapes |
| [curves] | boolean |
false |
Allow Bezier curves |
| [skeleton] | boolean |
false |
Enables skeleton mode to allow branch paths |
| [minPoints] | number | none |
none |
Minimum allowed number of points |
| [maxPoints] | number | none |
none |
Maximum allowed number of points |
| [pointsizeenabled] | number |
5 |
Size of a point in pixels when shape is selected |
| [pointsizedisabled] | number |
5 |
Size of a point in pixels when shape is not selected |
Result parameters
Kind: global typedef
Returns: VectorRegionResult - The serialized vector region data in Label Studio format
Properties
| Name | Type | Description |
|---|---|---|
| original_width | number |
width of the original image (px) |
| original_height | number |
height of the original image (px) |
| image_rotation | number |
rotation degree of the image (deg) |
| value | Object |
|
| value.vertices | Array.<Object> |
array of point objects with coordinates, bezier curve information, and point relationships |
| value.closed | boolean |
whether the vector is closed (polygon) or open (polyline) |
| value.vectorlabels | Array.<string> |
array of label names assigned to this vector |
Example results JSON export
{
  "original_width": 1920,
  "original_height": 1280,
  "image_rotation": 0,
  "value": {
    "vertices": [
      { "id": "point-1", "x": 25.0, "y": 30.0, "prevPointId": null, "isBezier": false },
      { "id": "point-2", "x": 75.0, "y": 70.0, "prevPointId": "point-1", "isBezier": true,
        "controlPoint1": {"x": 50.0, "y": 40.0}, "controlPoint2": {"x": 60.0, "y": 60.0} }
    ],
    "closed": false,
    "vectorlabels": ["Road"]
  }
}